How to view your Amazon Spending History

Are you an Amazon customer and want to know your total spending for the past month or year? Many of us are familiar with the credit card “End of Year Summary” that is sent to us each year – which details your spending and breaks-down your spending into categories. The challenge is, many of us spend a large percentage of our disposable income on Amazon – which only appears as a single line-item within the credit card Year End Summary report.
SpendSavi allows you to view the details of your Amazon spending and break your purchases down into categories. Now you can see exactly where you are spending (and saving) money on Amazon. To use SpendSavi, you first need to download your Amazon Order History report. SpendSavi provide directions and a link to Amazon where this report can be located.
VIEW YOUR CUSTOM SPENDING REPORTS
Once you have downloaded your Order History Report from Amazon, you are now ready to upload this report to SpendSavi. SpendSavi will analyze the Order History Report and create beautiful charts and summaries that you can use to view your Amazon spending history.
After SpendSavi analyzes your Amazon Order History Report, several charts are available to viewwithin your SpendSavi account.
Amazon Order History – Monthly Summary
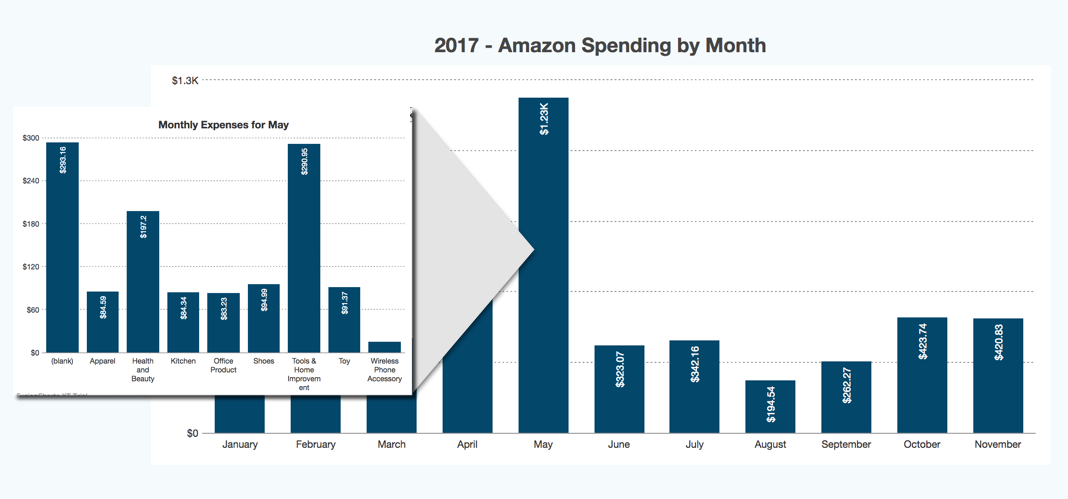
The Monthly Summary (Amazon Spending by Month) report displays the total spend for your account by month. Using this chart, you can easily identify which months had larger expenditures and then drill-down into the data to uncover the details.
Clicking on a particular month (May) on the chart will then display the Monthly Amazon Spend by category chart. Now you can see from the drill-down report that Tools and Home Improvement contributed to the high spend for this month. If you would like to see the items that were purchased in this category during this month – click on the Tools & Improvement bar on the chart.
Amazon Order History- Monthly Summary By Category
The Category Summary (Amazon Spending by Category) report displays the total spend for your account by category. Using this chart, you can easily identify which categories had larger expenditures and then drill-down into the data to uncover the details.
Clicking on a particular category (Health & Beauty) on the chart will then display the Monthly Amazon Spend by month chart for that category. If we click on any of the months on the bar chart – we can drill down and display the items purchased for that month in that particular category.